A system of linear inequalities consists of two or more inequalities with the same set of variables.
A solution of a system of linear inequalities is an ordered pair that satisfies all the given inequalities.
One method of solving inequalities is to graph the given inequalities on a coordinate plane. The solution set is the set of all ordered pairs where the graphs of two inequalities overlaps or intersects.
Let us explain this concept with a few examples.
Example 1:
Solve the system of inequalities by graphing method
y ≤ -x + 4
y > 3x - 8
Solution:
Step 1:
To solve the system of inequalities, we need to graph each line on the same coordinate plane. After graphing each line on the same coordinate plane, we need to find out the overlapping or intersecting regions. The set of ordered pairs where the graphs of the two equations intersects or overlaps is the solution for the system of linear inequalities.
Step 2:
y ≤ -x + 4 means y < -x + 4 or y = -x + 4
So, we need to draw the boundary line and then we need to shade the region which is less than y = -x + 4.
First graph the line y = -x + 4.
We can graph the above equation using table method or intercept method.
Let us use the intercept method.
Put x = 0 in y = -x + 4 and simplify.
y = -(0) + 4
y = 4
So, the ordered pair is (0, 4).
Next, put y = 0 in y = -x + 4 and simplify.
0 = -x + 4
x = 4
So, the ordered pair is (4, 0).
Hence, the boundary line passes through (0, 4) and (4, 0).
Step 3:
Draw a line through the points (0, 4) and (4, 0).
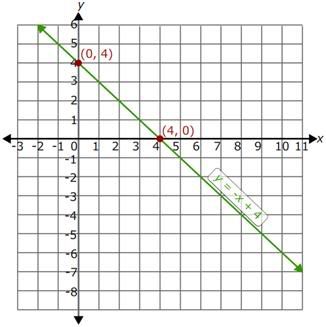
So, we have drawn the line y = -x + 4. We need to mark the solution set of y ≤-x + 4.
The line y = -x + 4 divides the coordinate plane in to two regions. Select a point from a half-plane and substitute in the above inequality, y ≤ -x + 4. If it satisfies the inequality, then the region which contains that point should be considered as the solution set.
If it does not satisfy, then we have to shade the other half-plane.
Let us take the point (0, 0).
Substitute (0, 0) in the inequality, y ≤ -x + 4.
0 ≤ -0 + 4
0 ≤ 4
This is true.
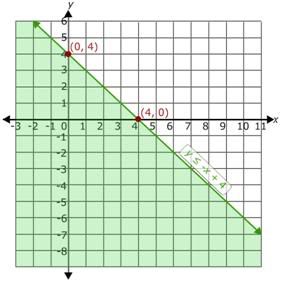
So, the region containing (0, 0) is the solution region and it should be shaded.
Since y ≤ -x + 4, the points on the boundary line y = -x + 4 is included in the solution set.
Step 4:
The graph of the inequality y ≤ -x + 4 is as shown.
Step 5:
Now, graph the inequality y > 3x - 8.
y > 3x - 8 means the region greater than the boundary line y = 3x - 8.
First, draw the boundary line y = 3x - 8 on the same coordinate plane.
Use the intercept form to draw y = 3x - 8.
Put x = 0 in y = 3x - 8 and simplify.
y = 3(0) - 8 = -8
So, the ordered pair is (0, -8).
Next, put y = 0 in y = 3x - 8 and simplify.
0 = 3x - 8
3x = 8
x = 8/3
So, the ordered pair is (8/3, 0).
Step 6:
Plot the points (0, -8) and (8/3, 0) on the coordinate plane.
Since y is greater than 3x - 8, the points on the boundary line are not included in the solution set. So join the (0, -8) and (8/3, 0) using dotted line for the inequality y > 3x - 8, to indicate that the points on the line are not included in the solution set.
Now, select a point from a half-plane and substitute in the above inequality, y > 3x - 8. Let us take the origin (0, 0).
Substitute (0, 0) in the inequality, y > 3x - 8.
0 > 3(0) - 8
0 > -8
It is true.
So, the region which contains the origin should be shaded.
Step 7:
The resultant graph is as shown.
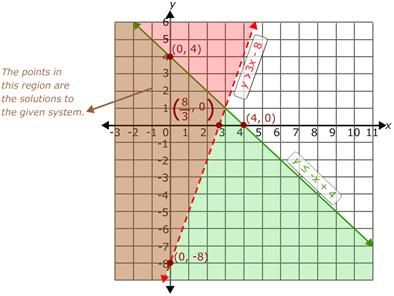
Step 8:
Now, look for the intersection of the two regions. The intersection or overlap of the two regions is the solution set of the given system of inequalities.
Example 2:
Solve the system of inequalities by graphing.
2x - y - 7 > 0
2x - y - 5 < 0
Solution:
Step 1:
Given inequalities are 2x - y - 7 > 0 and 2x - y - 5 < 0.
Consider 2x - y - 7 > 0 and solve for y.
y < 2x - 7
Consider 2x - y - 5 < 0 and solve for y.
y > 2x - 5
Step 2:
Graph the first inequality y < 2x - 7.
Draw the boundary line y = 2x - 7 using intercept form.
Put x = 0 in y = 2x - 7.
y = -7
So, the ordered pair is (0, -7).
Put y = 0 in y = 2x - 7.
0 = 2x - 7
2x = 7
x = 3.5
So, the ordered pair is (3.5, 0)
So, the line y = 2x - 7 passes through the points (0, -7) and (3.5, 0).
Step 3:
Draw the line through (0, -7) and (3.5, 0) and mark the region which is less than the boundary line. Consider the point (0, 0). Substitute the point (0, 0) in the inequality, y < 2x - 7.
0 < 2(0) - 7
0 < -7
This is false.
So, the region which does not have the point (0, 0) is the solution region.
Since the inequality has < sign, the points on the boundary line are not included in the solution set. So, join (0, -7) and (3.5, 0) using dotted line.
Step 4:
The resultant graph is as shown.
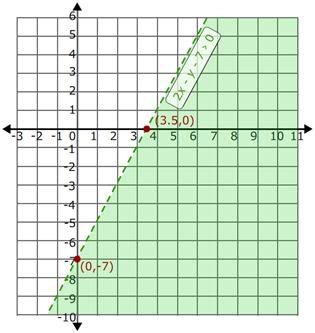
Step 5:
Similarly, plot the second inequality y > 2x - 5 on the same coordinate plane. The graph of the two inequalities is as shown.
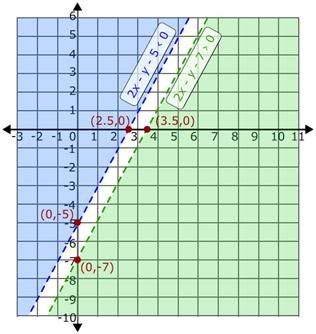
Step 6:
Now, look for the region where graph of the two inequalities intersects or overlaps.
It is clear from the graph that the two inequalities do not have any intersecting or overlapping region. So, there is no solution set for the given system of inequalities.
Step 7:
So, the given system of inequalities has no solution.
Practice Questions:
Solve inequalities using graphing method:
1) 3x – 4y < 2; 4x – 3y > -2
2) -2x + y ≥ 0; x – y ≤ 0
3) 5y ≥ 6x + 2; 6x ≥ 4y – 3
4) 4x + 6y ≤ 1; 2x + 3y ≥ 4
5) 1.5x + 2.5y > 4; -x + 3.5y < 0
Answers: 
Related Articles: