System of linear equations can be solved in three different ways. They are
a) Solving system of equations by graphing.
b) Solving system of equations by substitution.
c) Solving system of equations by elimination.
Solving systems of linear equations by Graphing:
It is a method of solving linear system of equations. In this method, we graph the given equations on the coordinate plane and look for the points of intersection. The point of intersection determines whether the system of linear equations has no solution, one solution, or infinitely many solutions.
Let us explain this method by few examples.
Example 1:
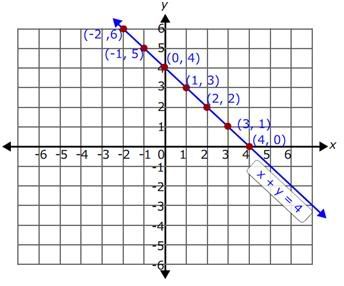
Solve the system of equations graphically.
x + y = 4
x - y = 2
Solution:
Step 1:
To solve a system of equations graphically, first graph the given two lines and then look for the point of intersection of those two lines. The point of intersection is the solution to the given system of equations.
Step 2:
Graph the linear equations on a coordinate plane by making a table of x and y values.
To find the value of y, first we need to solve the equation for y.
Step 3:
Consider the first equation x + y = 4.
Subtract x from both sides of the equation.
x - x + y = 4 - x
y = -x + 4
Now, randomly assign some values for x and find the corresponding values for y and make a table.
If x = -2, then y = -(-2) + 4 = 2 + 4 = 6
If x = -1, then y = -(-1) + 4 = 1 + 4 = 5
If x = 0, then y = -(0) + 4 = 4
If x = 1, then y = -(1) + 4 = 3
If x = 2, then y = -(2) + 4 = 2
If x = 3, then y = -(3) + 4 = 1
If x = 4, then y = -(4) + 4 = 0
So, the table of values of the equation x + y = 4 is
x
|
-2
|
-1
|
0
|
1
|
2
|
3
|
4
|
y = -x + 4
|
6
|
5
|
4
|
3
|
2
|
1
|
0
|
So, the ordered pairs for the equation x + y = 4 are (-2, 6), (-1, 5), (0, 4), (1, 3), (2, 2), (3, 1), (4, 0).
Step 4:
Plot all the above ordered pairs on the coordinate plane and join all the points.
Step 5:
Consider the second equation x - y = 2.
Subtract x from both the sides of the equation.
x - x - y = 2 - x
Now, simplify it.
-y = -x + 2
Multiply by (-1) on both the sides of the equation.
y = x - 2
Now, randomly assign some values for x and find the corresponding values for y and make a table.
If x = -2, then y = -2 - 2 = -4
If x = -1, then y = -1 - 2 = -3
If x = 0, then y = 0 - 2 = -2
If x = 1, then y = 1 - 2 = -1
If x = 2, then y = 2 - 2 = 0
If x = 3, then y = 3 - 2 = 1
If x = 4, then y = 4 – 2 = 2
So, the table of values of the equation x - y = 2 is
x
|
-2
|
-1
|
0
|
1
|
2
|
3
|
4
|
y = x - 2
|
-4
|
-3
|
-2
|
-1
|
0
|
1
|
2
|
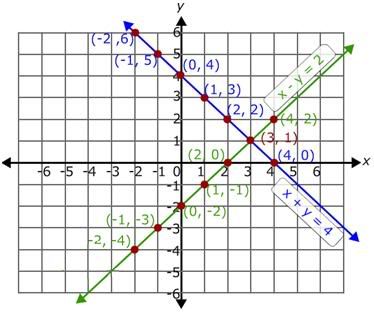
So, the ordered pairs for the equation x - y = 2 are (-2, -4), (-1, -3), (0, -2), (1, -1), (2, 0), (3, 1), (4, 0).
Step 6:
Plot all the above ordered pairs on the same coordinate plane and join all these points.
The resulting graph is as shown.
Step 7:
The point of intersection of the two lines is (3, 1).
Step 8:
So, (3, 1) is the solution for the given system of equations.
Checking the solution:
We can also check the solution by replacing the value of x and y in the two equations.
Replace the value of x by 3 and y by 1 in the equation y = -x + 4.
1 = -3 + 4
1 = 1
So, (3, 1) satisfies the equation y = -x + 4.
Replace the value of x by 3 and y by 1 in the equation y = x - 2.
1 = 3 - 2
1 = 1
So, (3, 1) also satisfies the equation y = x - 2.
Step 9:
So, (3, 1) is the solution for the given system of equations and the system of equations is consistent and the equations are independent.
Example 2:
Solve the system of equations graphically.
x – y = 4
x – y = 2
Solution:
Step 1:
To solve a system of equations graphically, first graph the given two lines and then look for the point of intersection of those two lines. The point of intersection is the solution to the given system of equations.
Step 2:
Graph both the equations on the coordinate plane.
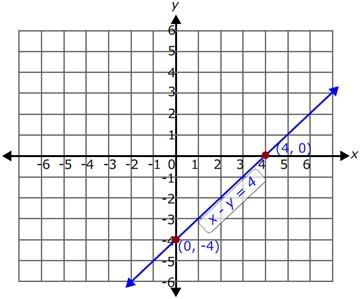
We can also graph the linear equations using the x and y-intercept.
Step 3:
Consider the first equation x - y = 4.
Replace x by 0 in the above equation, then we will get the y-intercept.
0 - y = 4
y = -4
For x = 0, the value of y is -4.
So, the ordered pair is (0, -4).
Now, replace y by 0 in the equation x - y = 4, then we will get the x-intercept.
x - 0 = 4
x = 4
For y = 0, the value of x is 4.
So, the ordered pair is (4, 0).
Thus, we get the two ordered pairs (0, -4) and (4, 0).
Step 4:
Now, plot these two ordered pairs on the coordinate plane and join them.
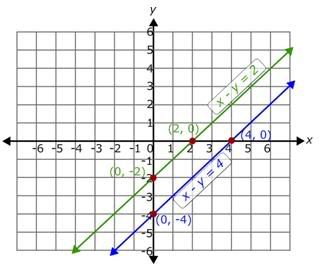
Step 5:
Similarly, consider the second equation x - y = 2.
Replace x by 0 in the above equation, then we will get the y-intercept.
0 - y = 2
y = -2
For x = 0, the value of y is -2.
So, the ordered pair is (0, -2).
Replace y by 0 in the above equation, then we will get the x-intercept.
x - 0 = 2
x = 2
For y = 0, the value of x is 2.
So, the ordered pair is (2, 0).
Thus, we get the two ordered pairs (0, -2) and (2, 0).
Step 6:
Now, plot these two ordered pairs on the same coordinate plane and join them.
The resulting graph is as shown.
Step 7:
Now, identify the point of intersection of the two lines. Here in the graph the two lines are parallel to each other. Parallel lines never intersect each other.
Step 8:
So, there is no solution for the given system of equations and the given system of equations is inconsistent.
Solving system of equations with three variables:
We can also solve the system of equations in three variables by graphing. Systems of equations with three variables represent planes. Draw the graph of three equations in a three dimensional plane and look for the point of intersection. The point of intersection is the solution of the system of equations.
Hold on. It is not so easy to draw planes in a piece of paper. You need a graphic calculator to do that. Moreover, in most of the cases it is really hard to find the point of intersection. It is not advisable to use graphing calculator to solve system of equations with three variables.
I suggest you to use substitution method or elimination method. The process of finding the solutions may be long but the solutions will be accurate.
Practice Questions:
Graph and solve the given linear equations
a) x-y = 4; x + 5y = -14
b) 3x + 5y = 2; 3x + 5y = -2
c) -9x + 8y = -2; 8x + 9y = 34
d) 3x + 4y = 8; 6x + 8y = 16
e) x - 2y = 2; 2x - 4y = 8
Related Articles:
You may also interested in this: